Deployment and reliability
Cross-day theme. Facts come from the linked day and paper notes. Sentences marked "my reading" are interpretation.
The industry talks shared one message: a model that works in the lab isn't a product. A product needs the reliability arithmetic, the fleet operations, and the evaluation tooling to go with it.
The reliability arithmetic
| Source | Day | The number | What it means |
|---|---|---|---|
| Tedrake / Walden | 2 | deploying needs 97–99% success | so tasks get constrained, then saturate |
| 2 | LBM 2.0: 340.3 s mean time between interventions, 98.2% autonomy | "could support 50 robots with 3 remote assistants" | |
| 2 | previous-generation LBM 78.5 s; gen 1 LBM 22.6 s | over 6 deployment weeks | |
| Dyna Robotics | 4 | over a 79-step cycle, 99% per step completes only 45.2%; 99.99% completes 99.2% | "Completing the job requires exceptional reliability at every step, plus recovery" |
| GaP / Agentic Robotics | 3 | FlipAnything 24.7% → 95.0% over 36 policy versions | the robot runs plain ROS 2 code, never a frontier model in its control loop |
Running a fleet
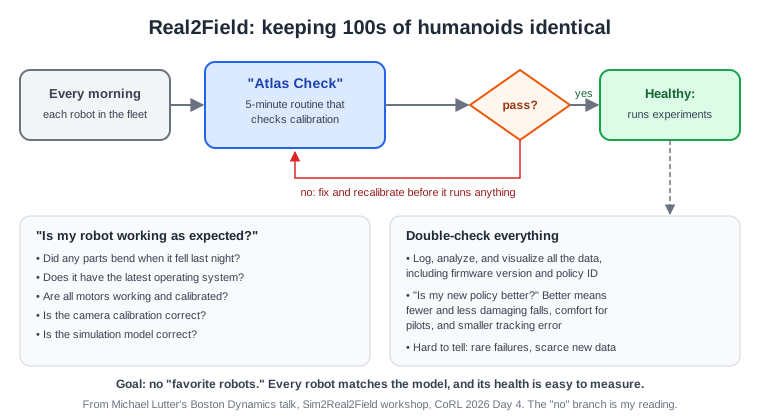
From Lutter's talk (Boston Dynamics, Day 4): - No favorite robots. - A 5-minute Atlas Check every morning. - Log everything, including firmware version and policy ID. - Comparing two policies is hard, because failures are rare, the new policy has less data, and pilots have adapted to the old one.
Building for deployment
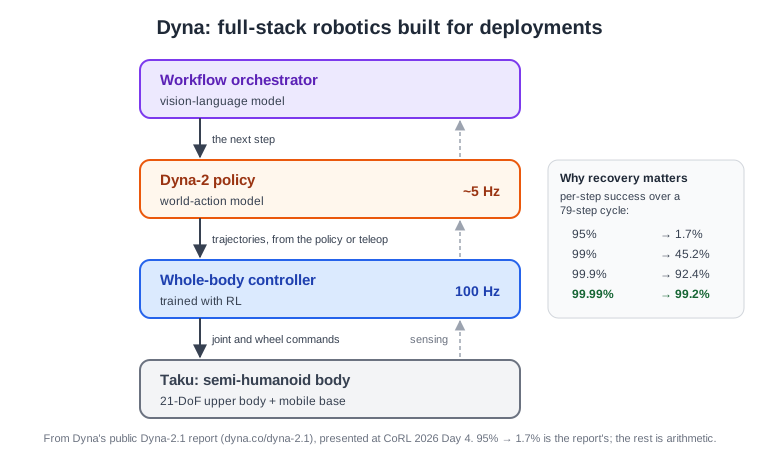
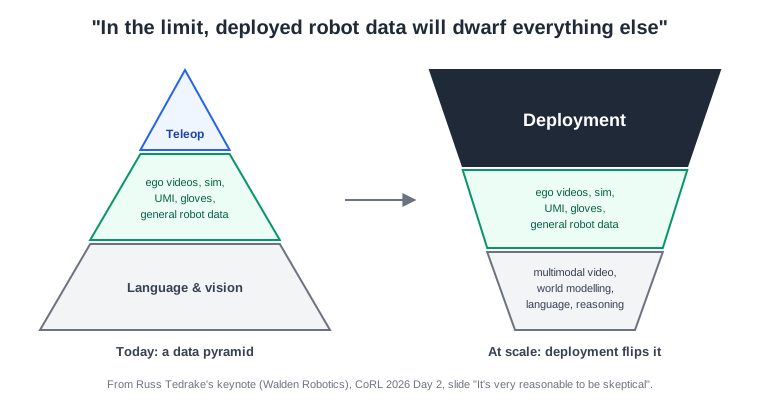
Other industry talks with the same message: - Tedrake: "The most valuable data is in the field." HG-DAgger interventions become training data, and stronger pre-trained models need fewer interventions but improve more from each one. - Dyna: Build the full stack for deployment. Their napkin-folding deployment went from about 35 napkins an hour at 75% quality (Dyna-1) to 95 an hour at 93% (Dyna-2), above the 1,500-per-shift requirement. One field lesson: missed grabs doubled, and the cause was a worn gripper. - AGIBOT: Genie Evolver, described as collective experience learning across 96 physical robots. - Boston Dynamics, Day 2: "Data quality before scale."
Knowing why a policy fails
| Tool | Day | What it measures |
|---|---|---|
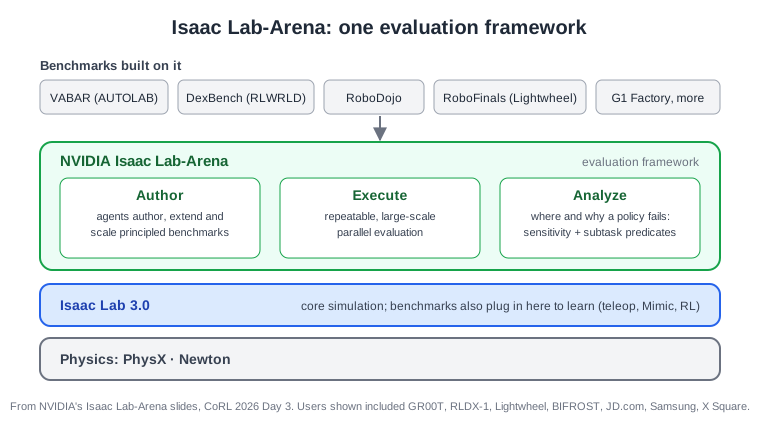
| Isaac Lab-Arena | 3 | The why: sensitivity to one factor at a time. π0.5 fails beyond +2 cm of wrist-camera shift; GR00T N1.7 fails below 70% light. The where: success at each stage, grasp 30.3% → lift 22.9% → place 20.0% |
| DexBench | 3 | frozen start states, per-cell success with 95% intervals, public leaderboard |
| MARS Lab | 1 | "In simulation, also report the success rate before a deadline, with inference time counted" |
Takeaways
- Per-step reliability compounds. Dyna's 79-step table and Tedrake's 97–99% requirement are the same arithmetic, which is why both stress recovery.
- Interventions are the metric and the data: mean time between interventions for operations, and interventions as training data (HG-DAgger).
- Evaluation needs to be diagnostic, not pass/fail (Arena), and comparable across models (DexBench).
- My reading: The unglamorous work of calibration, logging, and fleet health is what turns sim-to-real into real-to-field.